Project: GraphIT
A dependency graph for learning contents.
Status: ongoing
Runtime: 2021 -
Participants: Raphael Wimmer, Alexander Weichart, Leonie Schrod
Keywords: graph, dependency_graph, education, learning
Background

University students' backgrounds and goals are becoming more and more heterogeneous. This requires educators to design courses and curricula that are more flexible and can be combined and re-configured depending on changing requirements. However, there is little tool support for designing such courses or degree programs.
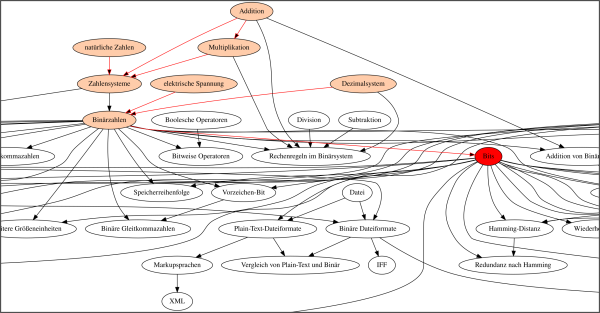
GraphIT is a new prototypical platform that investigates how dependency graphs can be used to model courses, curricula, and personal learning progress. The dependency graph can then be used to highlight central topics, paths between topics, and clusters of related topics. The initial focus lies on courses in higher education.
We are currently developing a prototype on Wikibase, the knowledge-graph platform powering Wikidata. The development is a iterative process, as the prototype is simultaneously being used in teaching.
The resulting platform not only helps identify learning paths but also supports course planning, course organization, and learning analytics.
The platform

The graph consist of nodes and edges.
Nodes, or Items represent either small learning topics or more abstract concepts, such as students or resource types.
Edges, or Properties represent relationships between topic, such as dependencies, or links to resources. Additionally Wikibase allows for adding edges to edges, or simply annotating an edge with additional data. This is used to track information, such as creation of a node or importance.
The prototype currently contains three completed courses with about 400 topics.
Wikibase's built-in query service SPARQL allows for auto-generated visualizations and reports. This can be used to create course pages, to show organisational information as well as generate information from the graph itself, such as a course timeline, important topics and students interests and precursory knowledge.
Additionally students can use the graph and its properties to attach a personal item to different nodes of the graph. Which results in a more personalized subgraph, to track learning progress or interests in topics.
Several custom frontends are being developed. They adress issues with visualisation and editing to allow for a better interaction with the graph.
Additional Material
Publications
Raphael Wimmer, Leonie Schrod, Alexander Weichart
- Fachtagung Bildungstechnologien (DELFI 2025)
We demonstrate GraphIT, a collaborative platform for organizing course contents and curricula in an extensible graph. (Tweet this with link)
![]()
![]()
All Related Posts
Talk: GraphIT - wie man mit einem Abhängigkeitsgraphen bessere Lehrveranstaltungen und Studiengänge bauen kann (2024-05-21)
Raphael Wimmer presented ongoing work on GraphIT at the KI-Campus Tool Tip Tuesday. Video recording (German, 35 minutes) available. (more...)
Raphael Wimmer awarded the Prize for Excellence in Teaching 2022 (2023-04-28)
One of 15 Bavarian educators who received this prize for extraordinary effort and results in teaching in higher education. (more...)
GraphIT - was man alles mit einem Abhängigkeitsgraph für Lerninhalte machen kann (2023-04-26)
Raphael Wimmer gave a Lightning Talk about the upcoming project at University:Future Festival. (more...)
"Graph-based Development of Curricula and Courses" (Lightning Talk at U:FF '21) (2021-11-02)
On 2. November 2021, Raphael Wimmer gave a Lightning Talk on “Graph-based Development of Curricula and Courses” at the University:Future Festival '21. (more...)